TL;DR

Prime made for students and young adults
- Fast, free delivery for dorm and study essentials
- Prime Video and Amazon Music included
- Member-only deals
Our World in Data reports that UK electricity generation per person has fallen by more than a third since its 2003 peak and is now around its late-1960s level. Higher net electricity imports explain part of the change, while lower use across industry, homes and commercial buildings reflects both economic shifts and efficiency gains.
The United Kingdom generates less electricity per person than it did in the 1970s, with output per resident now back around its late-1960s level, according to an October 3 analysis by Our World in Data. The measure has fallen by more than a third since its 2003 peak, a long-term reversal that reflects lower electricity use as well as a greater reliance on imports.
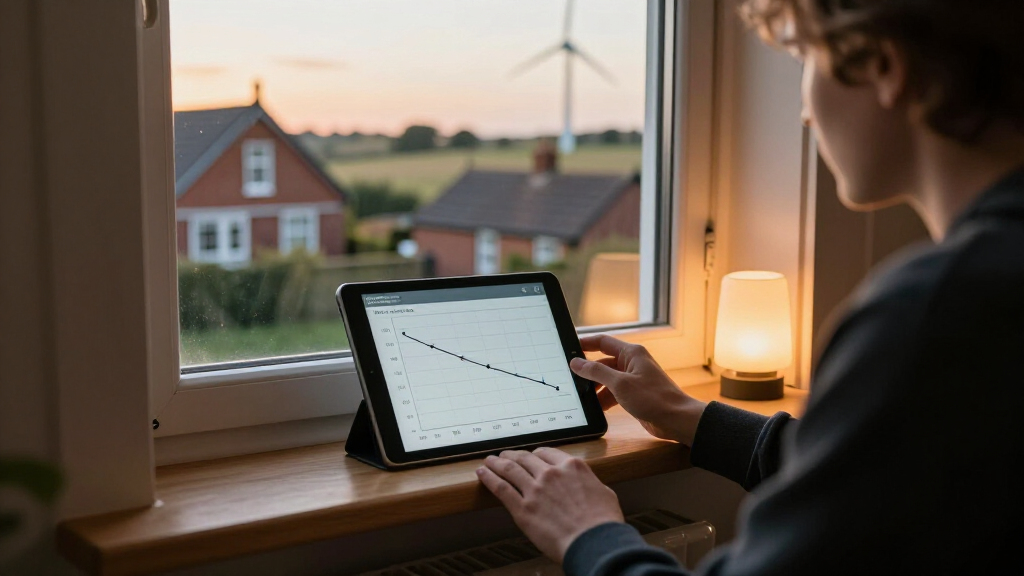
Our World in Data’s chart tracks electricity generation per person from 1920 to the present. It shows UK generation per resident reaching its high point in 2003 and declining by more than one-third afterward. The analysis compares that fall with a global rise of more than 50% in electricity generation per person this century.
Generation within the country is not the same as the electricity consumed by households and businesses. The report says net imports rose from 1% of electricity demand in 2010 to 9% in 2025, meaning a growing portion of UK demand was supplied from abroad rather than generated domestically. This accounts for part, but not all, of the fall in domestic generation per person.
The analysis also points to a substantial decrease in electricity consumption. International Energy Agency sector data cited by Our World in Data shows industrial electricity use fell by one-quarter since 2005. The report says residential and commercial electricity use also fell by a similar amount over that period, although its summary does not give exact values for those sectors.
Imports and Falling Electricity Use
The figures distinguish two developments that are often blurred together: less electricity generated inside the UK and less electricity consumed. Higher net imports mean the domestic generation trend alone does not show the full supply picture. At the same time, the analysis says UK consumption has fallen, so the change cannot be explained solely by importing a larger share of electricity.
The distinction matters when interpreting national energy trends and planning future supply. Generation per person is a measure of output relative to population, not a direct measure of energy security, electricity affordability, or the amount available to any individual. The report’s figures show a marked change in the country’s electricity system, but do not by themselves establish whether the trend is beneficial or harmful.
The report also complicates the idea that falling demand is mainly a result of the UK moving away from manufacturing. Industrial use has declined, but residential and commercial use has also fallen substantially. That points to wider changes in how electricity is used, including improvements in efficiency, rather than a single cause.
As an affiliate, we earn on qualifying purchases.
Why UK Electricity Use Fell
Our World in Data describes deindustrialization—the shift from manufacturing toward a more service-based economy—as part of the explanation for lower electricity demand. Industry is a major electricity user, and the International Energy Agency figures cited in the analysis show a one-quarter fall in industrial consumption since 2005. The report cautions that this is not the whole story.
It also identifies energy-efficiency improvements as an important factor. Examples include replacing incandescent bulbs with LEDs and introducing efficiency standards for appliances. Such changes can reduce electricity use while people continue to receive similar lighting or household services. The source does not quantify how much of the overall decline each factor accounts for.
The trend is presented against a broader historical record: UK generation per person has returned to a level comparable with the late 1960s, after rising to a peak in 2003. The report’s headline comparison concerns generation per resident; its discussion of sectoral consumption and imports helps explain why that measure has changed, but those are related, distinct indicators.
“Its generation per person peaked in 2003 and has fallen by more than a third since then.”
— Our World in Data
As an affiliate, we earn on qualifying purchases.
What the Figures Do Not Show
The supplied analysis does not provide the exact current generation figure in units such as kilowatt-hours per person, or a detailed year-by-year breakdown of the full decline. It also does not quantify the separate contribution of imports, deindustrialization and efficiency, so the relative weight of those causes remains unclear from this account.
The report gives the change in net imports as a share of electricity demand between 2010 and 2025, but does not detail the countries supplying that electricity or how imports varied over the period. Its sectoral comparison describes falls since 2005 but does not provide the underlying residential and commercial values in the supplied text.
Generation per person is an aggregate measure. The analysis does not establish how the trend relates to electricity prices, reliability, emissions, or differences in consumption between households. Those questions require other data and should not be inferred from the generation series alone.
As an affiliate, we earn on qualifying purchases.
Further Data Needed on Supply
The Our World in Data article presents historical and sectoral data through 2025; the supplied material does not announce a new government target, policy decision, or forecast tied to the finding. The next step for readers seeking a fuller explanation is to compare the generation series with data on imports, consumption by sector, population and the sources used to produce electricity.
Any assessment of whether the pattern will continue would require newer figures and an explicit forecast. Until those are available, the report establishes the direction and scale of the historical change, while leaving open how demand, domestic generation and imported supply will evolve.
As an affiliate, we earn on qualifying purchases.
Key Questions
What did the report find?
Our World in Data says UK electricity generation per person has fallen by more than a third since its 2003 peak and is now around its late-1960s level.
Does lower generation mean the UK uses less electricity?
Not by itself: generation measures electricity produced domestically, while consumption also includes electricity supplied through imports. The analysis says net imports rose from 1% of demand in 2010 to 9% in 2025, and also reports that UK electricity consumption has fallen.
Why has electricity use fallen?
The report identifies deindustrialization and energy-efficiency improvements as contributing factors. It cites a one-quarter fall in industrial electricity use since 2005 and says residential and commercial use also declined by a similar amount.
Does the report say the UK is using less electricity than in the 1970s?
Its headline comparison is about generation per person, which is now back around late-1960s levels. The article separately says the UK consumes much less electricity than it used to; the supplied summary does not give a precise 1970s consumption comparison.
Source: hn
Fall Picks
fall essentials
As an affiliate, we earn on qualifying purchases.